Chicken Road
Share reaching this position
Try EasyTry MediumTry HardTry Daredevil

Title 1 of 2 on Chicken Road Spins · InOut Games · 2024
This Chicken Road review looks at the original InOut game through the decision you make after each successful crossing: collect now or attempt another step.
Chicken Road Spins research team · How we approach learning the controls
Demo credits only. No cash value. Adults 18+.
Published theoretical return: 98% · Maximum payment under game rules: 10,000 USD
Learn this game’s modes and limitsYou choose the stake and one of four modes before the round begins. Each mode has its own ladder, so understanding the selected road matters more than memorising a dramatic endpoint.
The original was released on 4 April 2024. It has published 98% RTP, a 0.01–150 USD stake range and a 10,000 USD maximum win. Those figures give a useful starting picture. They do not predict a short session or make a casino account automatically suitable for your location.
Chicken Road Spins begins with demo because the controls are easier to explain when you have used them. Its credits cannot be withdrawn. After a successful crossing, the collect value belongs to the current position; a later multiplier still requires another surviving move.
This Chicken Road game review covers the original release, including play rules, difficulty, return, limits, browser access and the data behind the result blocks.
Before starting, read the stake and currency, then confirm the mode. If a phone keyboard covers the game, close it and check the digits again. The stake applies to that round. A new round can risk another amount, even if you never return to the cashier during the session.
After a crossing succeeds, distinguish the current collect value from the next factor. Collecting ends the attempt at the available amount. Continuing asks for another random crossing and can lose the chance to collect. The game does not require you to finish every step before stopping a surviving attempt.
A collision ends that attempt. The next one begins from the start and does not inherit progress or an entitlement to success. Several opening failures can be followed by another. The animation makes the event visible; it is not a timing puzzle you can solve by tapping at a chosen moment.
Easy begins at ×1.03, followed by ×1.07 and ×1.12. Its road has 24 steps and finishes at ×19.44. These early factors make a useful control exercise because you can read the change without needing a long run. You can learn collect from an early successful position.
Keep the demo stake unchanged while deciding where to collect. This makes the ladder’s role easier to see. A larger displayed amount can otherwise come from a larger stake rather than a farther step. The road’s last factor is only one potential position, not a description of a usual attempt.
Easy is still gambling when played with money. The label does not promise that an opening crossing will survive or that a small collect point is always reachable. Use it to understand the interface, not to treat repeated early attempts as a dependable way to grow a balance.
Medium has 22 steps, opening at ×1.12 and ending at ×1,788.80. Its second factor is ×1.28. Compared with Easy, the larger early factors are visible immediately. That change belongs to a different risk trade-off; it is not a bonus added to an otherwise identical road.
In demo, switch after finishing the current round and read the new label. Use the same practice amount, let a step resolve and look for the reached collect value. End the attempt if you have answered the question you came to test. You do not need to pursue the endpoint for the comparison to be useful.
A Medium win cannot tell you to raise a cash stake. A single successful attempt says what that attempt did. Even several successes do not reveal the server’s next result. Keep your comparison about the visible ladder rather than converting a pleasing practice sequence into a money plan.
Hard contains 20 steps, with ×1.23 at the beginning and ×41,321.43 at the end. Its second factor is ×1.55. The road presents larger potential values earlier than Easy, but those values are not amounts you already hold. Read the current collect opportunity separately from the rest of the ladder.
Medium and Hard differ from their opening factors, which can be compared at the same demo stake. Close one round, change the mode and confirm the same demo stake. This gives you a clear comparison without needing a high factor. It also keeps the selected label central when the road artwork looks familiar.
Do not interpret a shorter road as easier to complete. Step count describes the layout, while the random outcomes decide whether an attempt progresses. The available factors alone do not provide the whole probability distribution. A big endpoint should not choose the amount you put at risk.
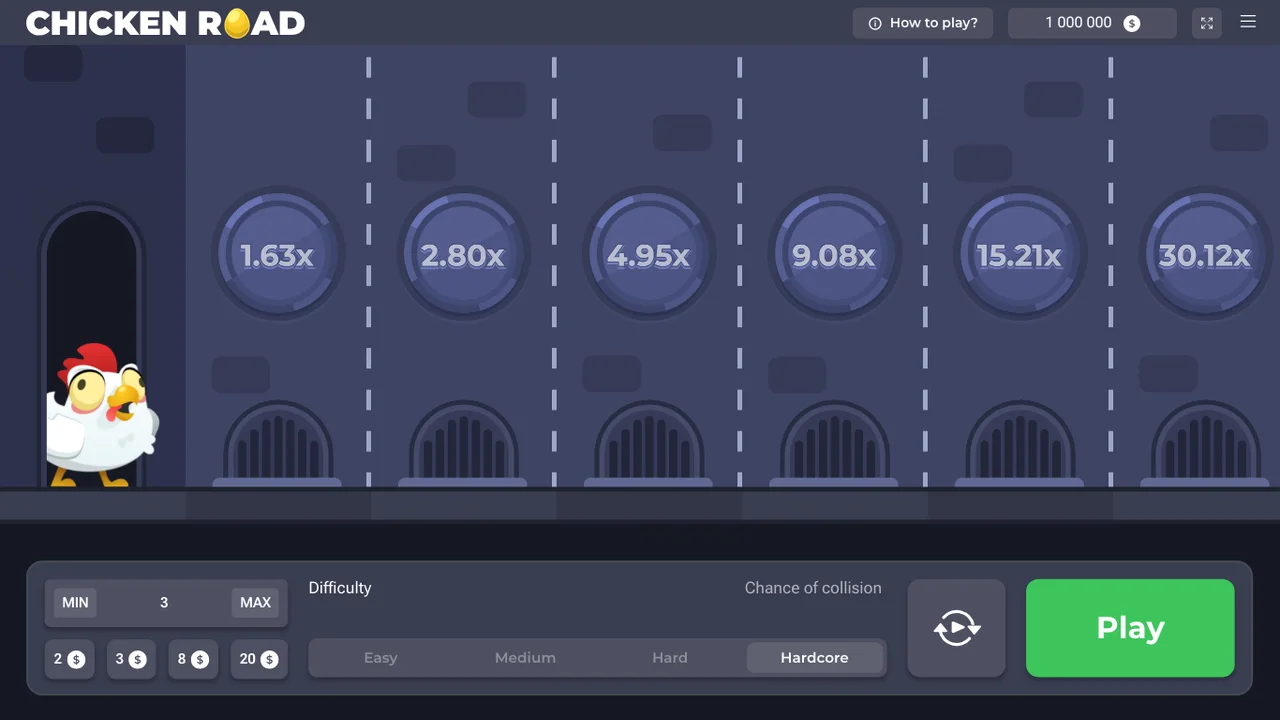
Daredevil has 15 steps and begins at ×1.63. Its final factor is ×2,542,251.93. That number is striking, but the original game’s maximum win remains 10,000 USD. A stake multiplied by the endpoint can produce larger arithmetic without producing a larger allowed payment.
Read the cap before using the calculator to explore high factors. The calculator helps explain gross return under its inputs, not the likelihood of reaching a step. It also does not replace the game’s payment rules. A screenshot of a factor cannot, on its own, establish what an account received.
Daredevil changes the opening collect decision as well as the far end of the road. Read its opening factor alongside the actual amount available to collect. A harder mode should not become a recovery tool after losses on another road. Changing the ladder does not make the next crossing predictable.
Chicken Road has published 98% RTP. The complementary house edge is 2% in long-run theory. This is not a promise to return 98% of a deposit during your visit. A short session can differ sharply, including losing the entire amount you set aside.
Turnover means the total amounts staked, including money used again after successful collects. It can exceed an initial deposit. Applying 2% only to the deposit therefore does not forecast the cost of repeated play. More importantly, theory does not choose whether an individual crossing succeeds.
Chicken Road 2 has 95.5% RTP according to InOut, with a 4.5% long-run house edge. The original figure stays with this title. A shared provider and related name do not justify transferring it to the sequel. Compare both games using their separate ladders and limits, with the sequel’s lower 95.5% return beside the original’s 98%.
A multiplier applies to the stake to describe gross return, before a cap or rounding. At ×1.12, USD 1 corresponds to USD 1.12 gross. The increase over the stake is USD 0.12. Calling the entire returned amount profit exaggerates what happened, especially at the low opening factors.
The original stake range is in USD. If a casino account uses your local currency, check the displayed equivalent and any conversion information. Do not copy a number from another screen without checking its unit. The game’s allowed range and a promotion’s maximum stake can also differ.
A casino handles deposits and withdrawals. Read its licence, location rules, payment methods and identity requirements before using cash. Check local gambling law rather than assuming access from a working game. None of the game’s published figures verifies the account service surrounding it.
The demo result blocks identify their title, difficulty, dates and included round count. Keep those labels attached to the numbers. A high result in one run describes that run; it does not tell you when another will appear. Read whether a chart measures reaching a position or ending there.
An average can move sharply when a run contains an unusually large outcome. The middle value and distribution may tell a different story. An empty category means it did not appear among the included rounds, not that it is impossible. These distinctions are more useful than searching for a lucky next position.
We keep the numerical results in their blocks rather than repeating totals in prose. They cannot independently audit the random process, determine a casino’s reliability or forecast a future attempt. Their role beside this review is showing what a finite demo run looked like.
InOut does not offer a standalone Chicken Road app. A mobile browser can provide the game through a service that supports it. Check the full title and provider name, because similarly named store packages can be unrelated. The browser can open those controls without installing a standalone game application.
On your phone, close the keyboard and check whether both the amount and collect control stay readable. Rotate the device if useful, then reread the mode. If the view stalls, let it reconnect and check the same round’s state. Refreshing cannot be treated as reversing a loss.
A useful brief session can end when you can identify the selected mode and explain move versus collect. That makes the game understandable without turning a demo result into a promise about money. Use the separate comparison when you want to see how the sequel changes the original figures.
Adults 18+ only: set spending and time limits, take breaks and never chase losses. Stop when your session limit arrives, independently of the position or balance reached.
| Mode you are viewing | Total steps in this mode | Factor after the first success | Factor at the road’s end | Hazards for this mode |
|---|---|---|---|---|
| Try Easy | 24 | 1.03× | 19.44× | Figure currently unavailable |
| Try Medium | 22 | 1.12× | 1,788.8× | Figure currently unavailable |
| Try Hard | 20 | 1.23× | 41,321.43× | Figure currently unavailable |
| Try Daredevil | 15 | 1.63× | 2,542,251.93× | Figure currently unavailable |
18+ only. Limit spending. Take breaks. Never chase losses.
The recorded demo sessions
Full starting group. Pointwise Wilson intervals.
Attempts included in this run: 6,000
Share reaching this position
| Selected game | Mode you are viewing | Attempts included in this run | Survival at the opening step | Uncertainty around the shown proportion | Roads completed | Highest factor reached in the run |
|---|---|---|---|---|---|---|
| Chicken Road · Try Easy | Try Easy | 1,500 | 94.87% | 93.63%–95.87% | 59 | 19.44× |
| Chicken Road · Try Medium | Try Medium | 1,500 | 88.53% | 86.82%–90.05% | 0 | 451.71× |
| Chicken Road · Try Hard | Try Hard | 1,500 | 79.47% | 77.35%–81.43% | 0 | 760.46× |
| Chicken Road · Try Daredevil | Try Daredevil | 1,500 | 60.93% | 58.44%–63.37% | 0 | 890.19× |
Highest coefficient reached. Later losses included.
| Road position | Rounds reaching the step | Attempts included in this run | Recorded share reaching this step | Uncertainty around the shown proportion |
|---|---|---|---|---|
| 1 | 1,423 | 1,500 | 94.87% | 93.63%–95.87% |
| 2 | 1,358 | 1,500 | 90.53% | 88.95%–91.91% |
| 3 | 1,297 | 1,500 | 86.47% | 84.64%–88.1% |
| 4 | 1,233 | 1,500 | 82.2% | 80.18%–84.05% |
| 5 | 1,187 | 1,500 | 79.13% | 77%–81.11% |
| 6 | 1,126 | 1,500 | 75.07% | 72.82%–77.19% |
| 7 | 1,073 | 1,500 | 71.53% | 69.2%–73.76% |
| 8 | 1,017 | 1,500 | 67.8% | 65.39%–70.12% |
| 9 | 968 | 1,500 | 64.53% | 62.08%–66.91% |
| 10 | 907 | 1,500 | 60.47% | 57.97%–62.91% |
| 11 | 836 | 1,500 | 55.73% | 53.21%–58.23% |
| 12 | 780 | 1,500 | 52% | 49.47%–54.52% |
| 13 | 723 | 1,500 | 48.2% | 45.68%–50.73% |
| 14 | 668 | 1,500 | 44.53% | 42.04%–47.06% |
| 15 | 604 | 1,500 | 40.27% | 37.81%–42.77% |
| 16 | 544 | 1,500 | 36.27% | 33.87%–38.73% |
| 17 | 482 | 1,500 | 32.13% | 29.82%–34.54% |
| 18 | 416 | 1,500 | 27.73% | 25.53%–30.05% |
| 19 | 351 | 1,500 | 23.4% | 21.33%–25.61% |
| 20 | 291 | 1,500 | 19.4% | 17.48%–21.48% |
| 21 | 235 | 1,500 | 15.67% | 13.92%–17.59% |
| 22 | 174 | 1,500 | 11.6% | 10.08%–13.32% |
| 23 | 115 | 1,500 | 7.67% | 6.43%–9.12% |
| 24 | 59 | 1,500 | 3.93% | 3.06%–5.04% |
| Road position | Rounds reaching the step | Attempts included in this run | Recorded share reaching this step | Uncertainty around the shown proportion |
|---|---|---|---|---|
| 1 | 1,328 | 1,500 | 88.53% | 86.82%–90.05% |
| 2 | 1,152 | 1,500 | 76.8% | 74.6%–78.87% |
| 3 | 997 | 1,500 | 66.47% | 64.04%–68.81% |
| 4 | 865 | 1,500 | 57.67% | 55.15%–60.14% |
| 5 | 739 | 1,500 | 49.27% | 46.74%–51.8% |
| 6 | 638 | 1,500 | 42.53% | 40.05%–45.05% |
| 7 | 543 | 1,500 | 36.2% | 33.81%–38.66% |
| 8 | 451 | 1,500 | 30.07% | 27.8%–32.44% |
| 9 | 365 | 1,500 | 24.33% | 22.23%–26.57% |
| 10 | 290 | 1,500 | 19.33% | 17.41%–21.41% |
| 11 | 229 | 1,500 | 15.27% | 13.54%–17.18% |
| 12 | 184 | 1,500 | 12.27% | 10.7%–14.02% |
| 13 | 140 | 1,500 | 9.33% | 7.96%–10.91% |
| 14 | 101 | 1,500 | 6.73% | 5.57%–8.12% |
| 15 | 76 | 1,500 | 5.07% | 4.07%–6.3% |
| 16 | 52 | 1,500 | 3.47% | 2.65%–4.52% |
| 17 | 30 | 1,500 | 2% | 1.4%–2.84% |
| 18 | 22 | 1,500 | 1.47% | 0.97%–2.21% |
| 19 | 14 | 1,500 | 0.93% | 0.56%–1.56% |
| 20 | 7 | 1,500 | 0.47% | 0.23%–0.96% |
| 21 | 3 | 1,500 | 0.2% | 0.07%–0.59% |
| 22 | 0 | 1,500 | 0% | 0%–0.26% |
| Road position | Rounds reaching the step | Attempts included in this run | Recorded share reaching this step | Uncertainty around the shown proportion |
|---|---|---|---|---|
| 1 | 1,192 | 1,500 | 79.47% | 77.35%–81.43% |
| 2 | 946 | 1,500 | 63.07% | 60.59%–65.47% |
| 3 | 713 | 1,500 | 47.53% | 45.02%–50.06% |
| 4 | 567 | 1,500 | 37.8% | 35.38%–40.28% |
| 5 | 441 | 1,500 | 29.4% | 27.15%–31.76% |
| 6 | 358 | 1,500 | 23.87% | 21.78%–26.09% |
| 7 | 257 | 1,500 | 17.13% | 15.31%–19.12% |
| 8 | 187 | 1,500 | 12.47% | 10.89%–14.23% |
| 9 | 126 | 1,500 | 8.4% | 7.1%–9.91% |
| 10 | 99 | 1,500 | 6.6% | 5.45%–7.97% |
| 11 | 62 | 1,500 | 4.13% | 3.24%–5.26% |
| 12 | 38 | 1,500 | 2.53% | 1.85%–3.46% |
| 13 | 25 | 1,500 | 1.67% | 1.13%–2.45% |
| 14 | 14 | 1,500 | 0.93% | 0.56%–1.56% |
| 15 | 7 | 1,500 | 0.47% | 0.23%–0.96% |
| 16 | 3 | 1,500 | 0.2% | 0.07%–0.59% |
| 17 | 1 | 1,500 | 0.07% | 0.01%–0.38% |
| 18 | 0 | 1,500 | 0% | 0%–0.26% |
| 19 | 0 | 1,500 | 0% | 0%–0.26% |
| 20 | 0 | 1,500 | 0% | 0%–0.26% |
| Road position | Rounds reaching the step | Attempts included in this run | Recorded share reaching this step | Uncertainty around the shown proportion |
|---|---|---|---|---|
| 1 | 914 | 1,500 | 60.93% | 58.44%–63.37% |
| 2 | 504 | 1,500 | 33.6% | 31.25%–36.03% |
| 3 | 277 | 1,500 | 18.47% | 16.58%–20.51% |
| 4 | 152 | 1,500 | 10.13% | 8.71%–11.76% |
| 5 | 72 | 1,500 | 4.8% | 3.83%–6% |
| 6 | 45 | 1,500 | 3% | 2.25%–3.99% |
| 7 | 17 | 1,500 | 1.13% | 0.71%–1.81% |
| 8 | 6 | 1,500 | 0.4% | 0.18%–0.87% |
| 9 | 3 | 1,500 | 0.2% | 0.07%–0.59% |
| 10 | 1 | 1,500 | 0.07% | 0.01%–0.38% |
| 11 | 0 | 1,500 | 0% | 0%–0.26% |
| 12 | 0 | 1,500 | 0% | 0%–0.26% |
| 13 | 0 | 1,500 | 0% | 0%–0.26% |
| 14 | 0 | 1,500 | 0% | 0%–0.26% |
| 15 | 0 | 1,500 | 0% | 0%–0.26% |
Demo records. No forecast. No RNG audit.
RNG: no independent audit here.
Algorithm, commitments, seeds and nonce required.
Chicken Road
| Road position | Factor reached here | Modelled proportion reaching this step | Recorded share reaching this step | Gross return per unit staked |
|---|---|---|---|---|
| 1 | 1.03× | 95.15% | 94.87% | 0.977 |
| 2 | 1.07× | 91.59% | 90.53% | 0.969 |
| 3 | 1.12× | 87.5% | 86.47% | 0.968 |
| 4 | 1.17× | 83.76% | 82.2% | 0.962 |
| 5 | 1.23× | 79.67% | 79.13% | 0.973 |
| 6 | 1.29× | 75.97% | 75.07% | 0.968 |
| 7 | 1.36× | 72.06% | 71.53% | 0.973 |
| 8 | 1.44× | 68.06% | 67.8% | 0.976 |
| 9 | 1.53× | 64.05% | 64.53% | 0.987 |
| 10 | 1.63× | 60.12% | 60.47% | 0.986 |
| 11 | 1.75× | 56% | 55.73% | 0.975 |
| 12 | 1.88× | 52.13% | 52% | 0.978 |
| 13 | 2.04× | 48.04% | 48.2% | 0.983 |
| 14 | 2.22× | 44.14% | 44.53% | 0.989 |
| 15 | 2.45× | 40% | 40.27% | 0.987 |
| 16 | 2.72× | 36.03% | 36.27% | 0.986 |
| 17 | 3.06× | 32.03% | 32.13% | 0.983 |
| 18 | 3.5× | 28% | 27.73% | 0.971 |
| 19 | 4.08× | 24.02% | 23.4% | 0.955 |
| 20 | 4.9× | 20% | 19.4% | 0.951 |
| 21 | 6.13× | 15.99% | 15.67% | 0.96 |
| 22 | 6.61× | 14.83% | 11.6% | 0.767 |
| 23 | 9.81× | 9.99% | 7.67% | 0.752 |
| 24 | 19.44× | 5.04% | 3.93% | 0.765 |
| Road position | Factor reached here | Modelled proportion reaching this step | Recorded share reaching this step | Gross return per unit staked |
|---|---|---|---|---|
| 1 | 1.12× | 87.5% | 88.53% | 0.992 |
| 2 | 1.28× | 76.56% | 76.8% | 0.983 |
| 3 | 1.47× | 66.67% | 66.47% | 0.977 |
| 4 | 1.7× | 57.65% | 57.67% | 0.98 |
| 5 | 1.98× | 49.49% | 49.27% | 0.975 |
| 6 | 2.33× | 42.06% | 42.53% | 0.991 |
| 7 | 2.76× | 35.51% | 36.2% | 0.999 |
| 8 | 3.32× | 29.52% | 30.07% | 0.998 |
| 9 | 4.03× | 24.32% | 24.33% | 0.981 |
| 10 | 4.96× | 19.76% | 19.33% | 0.959 |
| 11 | 6.2× | 15.81% | 15.27% | 0.947 |
| 12 | 6.91× | 14.18% | 12.27% | 0.848 |
| 13 | 8.9× | 11.01% | 9.33% | 0.831 |
| 14 | 11.74× | 8.35% | 6.73% | 0.79 |
| 15 | 15.99× | 6.13% | 5.07% | 0.81 |
| 16 | 22.61× | 4.33% | 3.47% | 0.784 |
| 17 | 33.58× | 2.92% | 2% | 0.672 |
| 18 | 53.2× | 1.84% | 1.47% | 0.78 |
| 19 | 92.17× | 1.06% | 0.93% | 0.86 |
| 20 | 182.51× | 0.54% | 0.47% | 0.852 |
| 21 | 451.71× | 0.22% | 0.2% | 0.903 |
| 22 | 1,788.8× | 0.05% | 0% | 0 |
| Road position | Factor reached here | Modelled proportion reaching this step | Recorded share reaching this step | Gross return per unit staked |
|---|---|---|---|---|
| 1 | 1.23× | 79.67% | 79.47% | 0.977 |
| 2 | 1.55× | 63.23% | 63.07% | 0.978 |
| 3 | 1.98× | 49.49% | 47.53% | 0.941 |
| 4 | 2.56× | 38.28% | 37.8% | 0.968 |
| 5 | 3.36× | 29.17% | 29.4% | 0.988 |
| 6 | 4.49× | 21.83% | 23.87% | 1.072 |
| 7 | 5.49× | 17.85% | 17.13% | 0.941 |
| 8 | 7.53× | 13.01% | 12.47% | 0.939 |
| 9 | 10.56× | 9.28% | 8.4% | 0.887 |
| 10 | 15.21× | 6.44% | 6.6% | 1.004 |
| 11 | 22.59× | 4.34% | 4.13% | 0.934 |
| 12 | 34.79× | 2.82% | 2.53% | 0.881 |
| 13 | 55.97× | 1.75% | 1.67% | 0.933 |
| 14 | 94.99× | 1.03% | 0.93% | 0.887 |
| 15 | 172.42× | 0.57% | 0.47% | 0.805 |
| 16 | 341.4× | 0.29% | 0.2% | 0.683 |
| 17 | 760.46× | 0.13% | 0.07% | 0.507 |
| 18 | 2,007.63× | 0.05% | 0% | 0 |
| 19 | 6,956.47× | 0.01% | 0% | 0 |
| 20 | 41,321.43× | 0% | 0% | 0 |
| Road position | Factor reached here | Modelled proportion reaching this step | Recorded share reaching this step | Gross return per unit staked |
|---|---|---|---|---|
| 1 | 1.63× | 60.12% | 60.93% | 0.993 |
| 2 | 2.8× | 35% | 33.6% | 0.941 |
| 3 | 4.95× | 19.8% | 18.47% | 0.914 |
| 4 | 9.08× | 10.79% | 10.13% | 0.92 |
| 5 | 15.21× | 6.44% | 4.8% | 0.73 |
| 6 | 30.12× | 3.25% | 3% | 0.904 |
| 7 | 62.96× | 1.56% | 1.13% | 0.714 |
| 8 | 140.24× | 0.7% | 0.4% | 0.561 |
| 9 | 337.19× | 0.29% | 0.2% | 0.674 |
| 10 | 890.19× | 0.11% | 0.07% | 0.593 |
| 11 | 2,643.89× | 0.04% | 0% | 0 |
| 12 | 9,161.08× | 0.01% | 0% | 0 |
| 13 | 39,301.05× | 0% | 0% | 0 |
| 14 | 233,448.29× | 0% | 0% | 0 |
| 15 | 2,542,251.93× | 0% | 0% | 0 |
Gross return, subject to caps.
Recorded sessions only. No forecast.
Model: RTP ÷ coefficient. Unverified assumptions.
| Road position | Recorded share reaching this step | Uncertainty around the shown proportion | Modelled proportion reaching this step |
|---|---|---|---|
| 1 | 94.87% | 93.63% – 95.87% | 95.15% |
| 2 | 90.53% | 88.95% – 91.91% | 91.59% |
| 3 | 86.47% | 84.64% – 88.1% | 87.5% |
| 4 | 82.2% | 80.18% – 84.05% | 83.76% |
| 5 | 79.13% | 77% – 81.11% | 79.67% |
| 6 | 75.07% | 72.82% – 77.19% | 75.97% |
| 7 | 71.53% | 69.2% – 73.76% | 72.06% |
| 8 | 67.8% | 65.39% – 70.12% | 68.06% |
| 9 | 64.53% | 62.08% – 66.91% | 64.05% |
| 10 | 60.47% | 57.97% – 62.91% | 60.12% |
| 11 | 55.73% | 53.21% – 58.23% | 56% |
| 12 | 52% | 49.47% – 54.52% | 52.13% |
| 13 | 48.2% | 45.68% – 50.73% | 48.04% |
| 14 | 44.53% | 42.04% – 47.06% | 44.14% |
| 15 | 40.27% | 37.81% – 42.77% | 40% |
| 16 | 36.27% | 33.87% – 38.73% | 36.03% |
| 17 | 32.13% | 29.82% – 34.54% | 32.03% |
| 18 | 27.73% | 25.53% – 30.05% | 28% |
| 19 | 23.4% | 21.33% – 25.61% | 24.02% |
| 20 | 19.4% | 17.48% – 21.48% | 20% |
| 21 | 15.67% | 13.92% – 17.59% | 15.99% |
| 22 | 11.6% | 10.08% – 13.32% | 14.83% |
| 23 | 7.67% | 6.43% – 9.12% | 9.99% |
| 24 | 3.93% | 3.06% – 5.04% | 5.04% |
| Road position | Recorded share reaching this step | Uncertainty around the shown proportion | Modelled proportion reaching this step |
|---|---|---|---|
| 1 | 88.53% | 86.82% – 90.05% | 87.5% |
| 2 | 76.8% | 74.6% – 78.87% | 76.56% |
| 3 | 66.47% | 64.04% – 68.81% | 66.67% |
| 4 | 57.67% | 55.15% – 60.14% | 57.65% |
| 5 | 49.27% | 46.74% – 51.8% | 49.49% |
| 6 | 42.53% | 40.05% – 45.05% | 42.06% |
| 7 | 36.2% | 33.81% – 38.66% | 35.51% |
| 8 | 30.07% | 27.8% – 32.44% | 29.52% |
| 9 | 24.33% | 22.23% – 26.57% | 24.32% |
| 10 | 19.33% | 17.41% – 21.41% | 19.76% |
| 11 | 15.27% | 13.54% – 17.18% | 15.81% |
| 12 | 12.27% | 10.7% – 14.02% | 14.18% |
| 13 | 9.33% | 7.96% – 10.91% | 11.01% |
| 14 | 6.73% | 5.57% – 8.12% | 8.35% |
| 15 | 5.07% | 4.07% – 6.3% | 6.13% |
| 16 | 3.47% | 2.65% – 4.52% | 4.33% |
| 17 | 2% | 1.4% – 2.84% | 2.92% |
| 18 | 1.47% | 0.97% – 2.21% | 1.84% |
| 19 | 0.93% | 0.56% – 1.56% | 1.06% |
| 20 | 0.47% | 0.23% – 0.96% | 0.54% |
| 21 | 0.2% | 0.07% – 0.59% | 0.22% |
| 22 | 0% | 0% – 0.26% | 0.05% |
| Road position | Recorded share reaching this step | Uncertainty around the shown proportion | Modelled proportion reaching this step |
|---|---|---|---|
| 1 | 79.47% | 77.35% – 81.43% | 79.67% |
| 2 | 63.07% | 60.59% – 65.47% | 63.23% |
| 3 | 47.53% | 45.02% – 50.06% | 49.49% |
| 4 | 37.8% | 35.38% – 40.28% | 38.28% |
| 5 | 29.4% | 27.15% – 31.76% | 29.17% |
| 6 | 23.87% | 21.78% – 26.09% | 21.83% |
| 7 | 17.13% | 15.31% – 19.12% | 17.85% |
| 8 | 12.47% | 10.89% – 14.23% | 13.01% |
| 9 | 8.4% | 7.1% – 9.91% | 9.28% |
| 10 | 6.6% | 5.45% – 7.97% | 6.44% |
| 11 | 4.13% | 3.24% – 5.26% | 4.34% |
| 12 | 2.53% | 1.85% – 3.46% | 2.82% |
| 13 | 1.67% | 1.13% – 2.45% | 1.75% |
| 14 | 0.93% | 0.56% – 1.56% | 1.03% |
| 15 | 0.47% | 0.23% – 0.96% | 0.57% |
| 16 | 0.2% | 0.07% – 0.59% | 0.29% |
| 17 | 0.07% | 0.01% – 0.38% | 0.13% |
| 18 | 0% | 0% – 0.26% | 0.05% |
| 19 | 0% | 0% – 0.26% | 0.01% |
| 20 | 0% | 0% – 0.26% | 0% |
| Road position | Recorded share reaching this step | Uncertainty around the shown proportion | Modelled proportion reaching this step |
|---|---|---|---|
| 1 | 60.93% | 58.44% – 63.37% | 60.12% |
| 2 | 33.6% | 31.25% – 36.03% | 35% |
| 3 | 18.47% | 16.58% – 20.51% | 19.8% |
| 4 | 10.13% | 8.71% – 11.76% | 10.79% |
| 5 | 4.8% | 3.83% – 6% | 6.44% |
| 6 | 3% | 2.25% – 3.99% | 3.25% |
| 7 | 1.13% | 0.71% – 1.81% | 1.56% |
| 8 | 0.4% | 0.18% – 0.87% | 0.7% |
| 9 | 0.2% | 0.07% – 0.59% | 0.29% |
| 10 | 0.07% | 0.01% – 0.38% | 0.11% |
| 11 | 0% | 0% – 0.26% | 0.04% |
| 12 | 0% | 0% – 0.26% | 0.01% |
| 13 | 0% | 0% – 0.26% | 0% |
| 14 | 0% | 0% – 0.26% | 0% |
| 15 | 0% | 0% – 0.26% | 0% |

Published theoretical return: 95.5% · Maximum payment under game rules: 20,000 USD
In the original InOut game, set a stake and mode, attempt a crossing and collect after a success or continue. A collision ends the round.
The original has published 98% RTP, corresponding to a 2% house edge in long-run theory. It does not predict your short session.
In the original’s Easy mode, 24 positions take the multiplier from ×1.03 to ×19.44. The sequel uses a different Easy ladder.
The original maximum win is 10,000 USD. That cap matters even when stake multiplied by a ladder factor produces a larger uncapped amount.
No. You can collect after a successful crossing. An early surviving step can be enough to learn how the control ends an attempt.
No. Demo uses credits without cash value. Its outcome does not predict a money round or verify the casino holding an account.